
When talking about degrowth –the planned transition to a contraction-based, socially just, and ecologically sustainable society– or a postgrowth economy –an economy that is in a dynamic steady state and sustainable in the long-term– issues of macroeconomic policy are becoming shaky and unclear from the classical economics perspective which is still focused on perpetual economic growth. In the wider degrowth/postgrowth movement you have to credit Tim Jackson and Peter A. Victor for probably the most insightful work until now into this subject. But maybe even the economically ‘uninitiated’ can get a quick grasp on what the macroeconomics of degrowth might look like by returning to Marshall’s cross: the old tried and tested supply and demand diagram, where the vertical axis is depicting changes in price levels while the horizontal axis is depicting changes in aggregated output i.e. how much goods and services an economy produces.
I start with explaining the characteristics of the supply side as shown here on the right. T he supply curve S stands for all production activities within the economy; it is the aggregated supply across all economic sectors, across all individual companies. S can also be treated as the aggregated cost curve of the economy. The slope is upward i.e. the higher the price level for a good, the more the producer would be willing to produce. The far left part of S is the so-called Keynesian part: a situation in which the economy and its production capacities are dramatically under-utilized. Even strong increases of output, denoted with the letter Y, would not increase price levels that much i.e. inflation is of no concern. Then comes the middle part which can be seen as the more or less normal segment of S in which economic expansion of Y is accompanied by an increase in P. On the right end of S we reach the production capacity of the economy which is sketched here as a vertical line: the upper limit of economic output for a given constellation of producers (i.e. amount of companies, factories, machines and so forth). An economy producing at full capacity cannot increase Y anymore, therefore if e.g. demand would still be growing, P would increase sharply with Y staying at Ymax.
S can change in several ways. It can shift down when production costs are decreasing (lower wages, lower resource costs, more efficient technologies, tax cuts for companies) or up when these costs are increasing (higher wages, higher resource costs, technological dead-ends, tax increases for companies). S can also shift to the right through adding new companies to the economy, new production facilities or new production technologies. The right shift can also occur because of continued increase of demand that attracts new competitors or as a result from decreased costs (downward shift of S). A left shift means the exact reversal i.e. less production capacity, less companies, less factories. This can be caused by a permanent fall in demand or as a result of increased costs (upward shift of S). But S can also change its slope i.e. how sensible Y is to a change in P and vice versa. If productivity in the economy increases i.e. the relation of output per input (mostly calculated with GDP/labor hours) improves, the slope of S lessens i.e. the economy can expand with a diminished price increase than before the productivity increase occurred. Similar results come from increased market flexibility i.e. deregulation of labor and other markets, cutting back on red tape and the likes. That is the case for the neoliberal dogma of ‘freeing the market’ in order to allow the economy to expand with a decreased pressure on inflation. The slope of S will steepen in the reverse case i.e. when productivity declines or markets become more regulated. In this case an increase in Y would yield a greater increase in P than before.
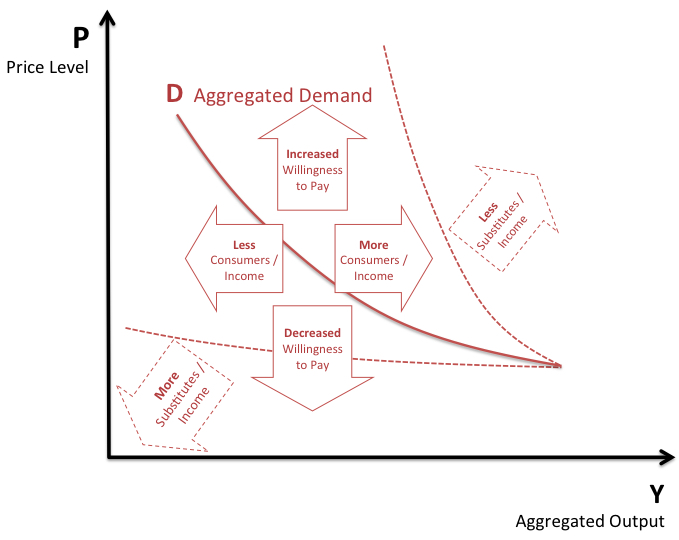
Now for the demand side of Marshall’s cross as shown here on the left. The demand curve D is downward sloping i.e. the lower the price level the willingness on the side of the consumers to demand more output. Just as the supply curve is an aggregation of all production activities, so is the demand curve an aggregation of all consumptive activities in the economy. The left end of the curve has a steeper slope than the right end of it; this implies that in a situation with high prices only the most willing consumers are buying – be it out of enough income or pressing needs. The right end of the slope gets more ‘elastic’ as the economists call it i.e. small changes in P create big changes in consumption of Y – due to high income levels connected to the production of Y, consumers are now able to buy more than in the previous situation. In some drawings you find that D is hitting the P-axis in the so-called ‘prohibitive price’ and the Y-axis in the so-called ‘saturation output’.
D can change just as S can. Shifting to the left implies less consumers i.e. through a decline in population or a decline in income due to wage cuts or increased income taxes, sales taxes or social security taxes. The downward shift of D can then be seen as a time-delayed result of income-induced left-shift: consumers willingness to pay decreases. This can also occur when the products available become outdated or when consumers reestimate their valuation of a product. Increasing income or population will shift D to the right. This might also result in an upward shift of D thus increasing consumers’ willingness to pay more P for any given Y. The slope of D can also change. It can lessen i.e. become more elastic. That is the case when either more income is available to consumers or more substitutes to any given product are available so that even small changes in P will cause large changes in Y. In the reverse case the slope can also steepen and become inelastic or rigid: even large changes in P will not change Y very much.
Taking both sides together we arrive at Marshall’s cross:

In the growth economy, policy suggestions would be rather straightforward: allow for a slow but steady increase of income (pushing D to the right, incentivizing business to invest in more production -> more Y), create competition and innovation through flexible start-up environments and investment opportunities (thus providing steady substitutes and flattening D -> dampening P), foster technological progress and keep markets (especially labor markets) flexible (flattening S -> dampening P), keep taxation levels low for all sides (pushing S down, shifting D further right -> dampening P, more Y), and keep the economy growing while carefully watching price levels. This is mainstream economics according the neoclassical synthesis and also the new neoclassical synthesis (including all Keynesianisms). Feel free to draw the diagram and change the curves along the different shifts. Remember: each shift stands for the result of a certain macroeconomic policy
Now let us turn to planned degrowth and the environment of a postgrowth economy.
We can think of several scenarios. One might be that we wish to carefully contract the economy to a sustainable steady state. Another might be that S cannot be right-shifted anymore due to severe ecological limitations, diminishing return on investments (maybe because an aging population consumes less or so differently that significant production capacity is no longer needed), or failure in technological breakthroughs (that would be the Huebner / Gordon explanation). Or we are slowly approaching the steady state in an always more slowly growing economy that will eventually come to a standstill.
Lets just a ssume, for a starter, that we want to actively contract the economy without creating too much and too rapid breakdown in P and Y. Actively reducing income and shifting D to the left might not be such a feasible option politically. After all, who is happy when income and sales taxes go up and wages go down? Besides, the willingness to pay would most likely also decrease thus shifting D downward, causing a further contraction of Y and P altogether. Reminds us about the 1930s and deflation. Leaving demand aside for the moment, an upward shift in S via increased resource pricing would on the contrary also provide an ecologically beneficial effect in addition to a reduction of Y. This upward shift of S might also cause a shift to the left thus reducing overall production capacity – which might in fact be desired and would happen in a postgrowth scenario almost by itself. However, we would then look at an economy with a sharply decreasing Y and continuously increasing P. In order to reduce price level increases, a flattening of both curves might be sensible. Lessening the slope of D through more substitutes, maybe even more so outside of markets i.e. home production or community production, can assist in bringing down price levels – at the expense of yet more Y. So lessening the slope of S becomes imperative. If productivity increases cannot be achieved anymore then markets have to be made more flexible and red tape cut back extensively. This would bring down P to the pre-contraction levels and also enable Y to decrease more smoothly and not too sharply. This is an interesting result of our little thought experiment so far: supply side oriented economic policies will be surprisingly significant for planned degrowth!
Lets try out one more sit uation: if the economy is already operating in a postgrowth environment and there are no real options for expanding production beyond an established (and sustainable) capacity level. The task becomes straightforward again: move the economy to capacity levels and keep it there. Increasing demand would not be feasible beyond capacity as then only P would go up. Instead it would be again quite sensible to lessen the slope of S through more market flexibility and/or lessen the slope of D through more substitutes. It might even be worth pondering to lower production costs by cutting on company taxes thus shifting the supply curve down. The result would be dramatically increased Y almost up to capacity levels and (small) decrease in P. In the postgrowth case it is probably less surprising that almost textbook like policies would deliver the trick. However, in the discussion on planned degrowth and the contexts of a postgrowth economy, established macroeconomics often have been somewhat discredited, mostly with the label ‘neoliberalism’ or ‘neoclassical’.
This little exercise here was intended to show that we should not forget everything we know about economics in order to manage the transition towards an economy beyond growth. True, this is really a very simple picture of economic knowledge and background. It omits a lot: effects on employment, government spending, trade, non-traditional labor markets, shadow economy, household economy, interest and money, non-monetary means of economic exchange, not to mention the natural environment and so forth. That is however always how science tries to make sense of something. Abstract from reality as much as possible and reduce to the minimum that is just about feasible. Maybe this was too reductive, granted. But it should caution all of us involved in the degrowth movement to side too easily with certain economic recipes and carelessly abandon others. Marshall’s cross still has something to say.